Abstract
Keywords
1. Background
In recent years, the use of organic dyes in many industries such as textile, cosmetics, plastics, food, and leather has increased considerably (1, 2). By estimation, the production of dyes is over 7 × 10⁵ tons per year and 10% - 15% of these dyes are given to aqueous environments (1, 3). These data show that the quality of water resource is strongly threatened since dyes not only give an unpleasant color to the waters but also, in some cases, can generate perilous by-products through reactions taking place in the waste phase (4, 5).
Malachite green (MG), a cationic triphenylmethane dye, is used as a biocide in the aquaculture industry (6, 7). This biocide is highly effective against important fungal and protozoal organisms (8); it is also used as a dye for materials such as cotton, silk, paper, leather, and ceramics (6, 7, 9). MG is difficult to biodegrade and has toxic effects on human cells, experimental mammals and other aquatic animals (7). It may cause liver tumor, skin diseases, and even skin cancer after prolonged exposure (10, 11). Nevertheless, it is still used in many areas of the world due to its low cost, availability, and ready efficaciousness, and for lack of suitable alternatives (6, 7). Owing to its widespread use, MG can cause serious contamination to the environment (7).
Several methods including ozonation, chemical oxidation, electrochemical oxidation, coagulation, adsorption, and nanofiltration are used in treatment of dye in wastewater (7, 9, 12). Recently, advanced oxidation processes (AOPs) have been recommended as an efficient option for degradation of dye from wastewater (13). In these processes, the hydroxyl free radicals generated are responsible for the oxidation of organic pollutants (6). Among the AOPs, the Fenton process, which is based on an electron transfer between hydrogen peroxide (H2O2) and a metal catalyst (Fe2+), is the most commonly used due to its high efficiency and simplicity in operation (6, 14). In the Fenton process, hydroxyl free radicals (OH) are produced in an acid mixture of Fe2+ and H2O2, according to the following Equation ((9, 15):

In recent years, several researchers have used advanced electrochemical oxidation processes (EAOPs) such as electro-Fenton process (EFP) to treat a variety of dyes (6). EFP can be divided into three classes depending on the purpose of current supply. The Fenton sludge recycling method uses electrical current to induce the reduction of ferric hydroxide sludge to form Fe2+. In the “EF-H2O2” method, ferrous ion is added from the outside and hydrogen peroxide is generated using an oxygen spraying cathode. In the “EF-Fe ox” method, H2O2 is added from the outside while ferrous ion is produced by the oxidation of sacrificial iron anode. The last class is similar to the process used in this study (14, 16).
To date, the degradation of MG dye has been conducted in various EF systems using different electrode materials. Table 1 summarizes these studies in the selected published literature. Accordingly, EF reactors have been operated in low concentrations of MG dye in order to attain sufficient removal efficiency. Thus, the main aim of this work is to investigate the removal efficiency of EFP using sacrificial iron electrodes for degradation of a high concentration of MG dye. In this regard, the effect of reaction temperature, distance between the electrodes, electrolysis time, concentration of MG dye, kinetic of the reaction, COD removal, mineralization efficiency and energy consumption of EFP and ECP were determined. Some experimental parameters were already optimized (pH = 3, current density = 10 mA Cm-2, CH2O2 = 50 mg L-1) and 94% color was removed under these optimum conditions for 200 mg L-1 of MG after only 10 minutes of treatment.
Summary of the Selected Literature on Degradation of MG by EFP
| Electrodes | Experimental Conditions | Malachite Green Concentration, mg L-1 | Removal Efficiency, % | Reference |
|---|---|---|---|---|
| Graphite felt-Pt | (Fe3+) = 0.2 mM, electrolysis time = 22 min, applied current = 200 mA, (Na2SO4) = 0.05 mM, pH = 3, at room temperature | 182.5 | 100 | (5) |
| CF-BDD | (Fe2+) = 0.5 mM, electrolysis time = 30 min, current density = 21.7 mA cm-2, (Na2SO4) = 0.05 mM, pH = 3, temperature = 25°C | 150 | 86 | (6) |
| Carbon PTFE-Pt sheet | (Fe2+) = 0.5 mmol dm-3, electrolysis time = 15 min, current density = 66.7 mA cm-2 (Na2SO4) = 0.05 mol dm-3, pH = 3, temperature = 35°C | 177 | 98 | (17) |
| Carbon felt-Pt | (Fe3+) = 0.2 mM, electrolysis time = 12.5 min, applied current = 60 mA, (Na2SO4) = 0.05 M, pH = 3, at room temperature | 18 | 100 | (18) |
| Carbon felt coated with iron oxides-BDD | (Fe2+) = 0.5 mM, electrolysis time = 15 min, current density = 21.7 mA cm-2, (Na2SO4) = 0.05 M, pH = 3, temperature = 25°C | 150 | 74 | (19) |
| Cathode and anode, both made of iron | Solution pH = 3, current density = 10 mA cm-2, H2O2 dosage = 50 mg L-1, reaction time = 30 min | 1000 - 3000 | 65 - 100 | Present study |
2. Methods
2.1. Chemicals
Malachite green, chemical formula = C23H25ClN2, λ max = 618 nm, MW = 364.911 g mol-1, was purchased from Aldrich. A stock solution (5 g L-1) of MG dye was prepared in distilled water and diluted when necessary. The chemicals used in this study (H2SO4, NaOH, and H2O2) were obtained from Merck company.
2.2. Electrolytic System
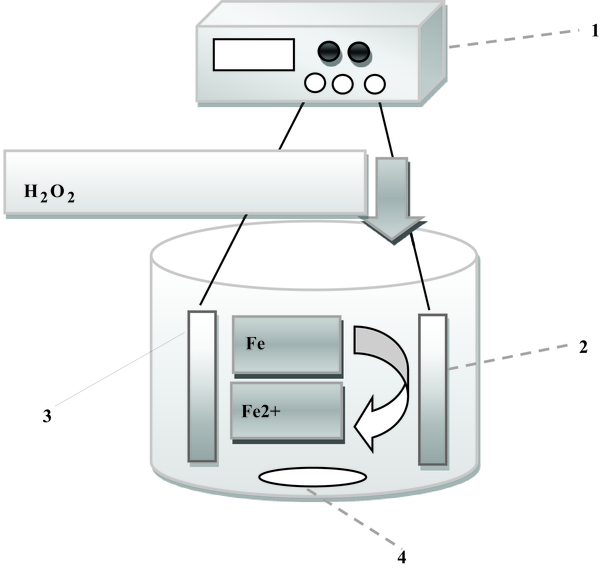
The electrochemical batch reactor was made of glass, 8 cm high and 5 cm in diameter, with a working volume of 250 mL. Two iron plate electrodes (i.e., one anode and one cathode) with measuring 60 × 40 × 2 mm were located in reactor. The total active electrode surface area was 10 cm2. The cathode and anode sets were connected to negative and positive outlets of DC power supply (PS-305D model; 30 V, 5A) respectively, which discharged electrical current into the mixture when needed. Before each experiment, in order to remove organic impurities and oxide layer active electrode surface area, were soaked in HCl solution (30%) for 5 minutes, and then rinsed with distilled water. In all experiments, a magnetic stirrer (Alfa, HS-860) was used (300 rpm) to create turbulence completely and ensure homogenous condition in the reactor (Figure 1).
Experimental setup; power supply (1), sacrificial anode (2), cathode (3), magnetic stirrer (4)

2.3. Analytical Procedures
In each run, the initial pH of 250 mL of dye solution was adjusted to 3 (AZ 8651 model) using 1N H2SO4 or 1N NaOH, and was then placed in the reactor. To increase conductivity, 500 mg L-1 of NaCl was used in all experiments as supporting electrolyte. Before turning on the power supply, a specific amount of H2O2 (mg L-1) was added to electrochemical reactor to initiate the EF process. At the end of the process, 20 mL of reaction mixture was taken and centrifuged at 4000 rpm for 5 minutes (Heraeus Labofuge 200 model). The centrifuged dye solution was then analyzed to determine the COD, TOC, and residual concentration of MG. COD measurements were performed using COD digestion vials, high range, (HACH Chemical) with a spectrophotometer (DR 5000, HACH). The removal efficiency (Y) of dye solution was determined by measuring absorbance values before and after treatment process in the max wavelength (λ max = 619 nm) based on the following Equation:

Where A0 and A1 are absorbance values before and after treatment process, respectively.
The limit of MG dye mineralization in EFP and ECP was measured by determining total organic carbon (TOC) of the solution using TOC analyzer (Shimadzu) before and after the processes. Percentage of TOC removal was calculated as follows:

Where TOCt and TOC0 (mg L-1) are the initial and final TOC of the solution, respectively (9).
Energy consumption is electrical spent to reduce per unit mass of COD, which was calculated using the following Equation:

Where V is average cell voltage in volte (V), I is the applied current in ampere (A), t is the experiment time (hour), (∆COD) is the corresponding COD decay (mg L-1), and VS is the volume of solution (17).
3. Results and Discussion
3.1. Effect of Temperature
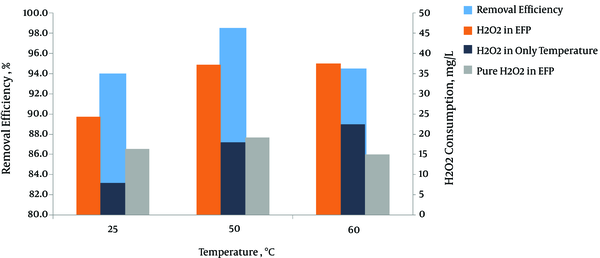
To investigate the effect of reaction temperature on the removal efficiency of MG dye, electrolysis was performed at different temperatures of 25°C, 50°C, and 60°C. Figure 2 shows the results of this work. The removal efficiency of MG dye increased from 94% to 99% as the temperature increased from 25°C to 50°C. Increasing the temperature would increase the reaction rate between H2O2 and the catalyst, and therefore increase the rate of generating oxidizing species such as hydroxyl free radicals. Moreover, a higher temperature can provide more energy for the reactant molecules to dominate reaction activation energy (9, 18). The results also illustrated that the degradation efficiency decreased to 94.5% when the temperature increased to 60°C. This phenomenon can be explained by the lower concentration of dissolved oxygen and the self-decomposition of H2O2 to water and oxygen at higher temperatures (15, 19). To get a better understanding of the role of temperature in this reaction, the following Equation is is used:

Degradation efficiency of MG dye at various temperature; Cdye = 200 mg L-1, T = 10 minutes, CD = 10 mA cm-2, pH = 3, CH2O2 = 50 mg L-1, d = 1 cm

Where PH2O2 cons, H2O2 cons EFP, and H2O2 cons tem are pure H2O2 consumed in EFP, total H2O2 consumed in EFP and H2O2 consumed if the temperature is used alone. The highest amount of H2O2 consumed, if the temperature is used alone, is at 60°C equal to 22.8 mg L-1 but maximum and minimum amount of pure H2O2 consumed are at 50°C and 60°C, respectively (Figure 2). This result shows that at higher temperatures, H2O2 undergoes self-decomposition (Equation 6) (18).

In a study by Hameed et al. (20) similar results were also observed. Hameed et al. (20) reported that MG removals percentage increased from 85.59 to 98.14% as the temperature increased from 30°C to 50°C during the first 10 minutes of the Fenton process. Panizza et al. (18) reported that the degradation rate of alizarin red dye increased when the temperature increased from 25°C to 35°C.
3.2. Distance Between the Electrodes
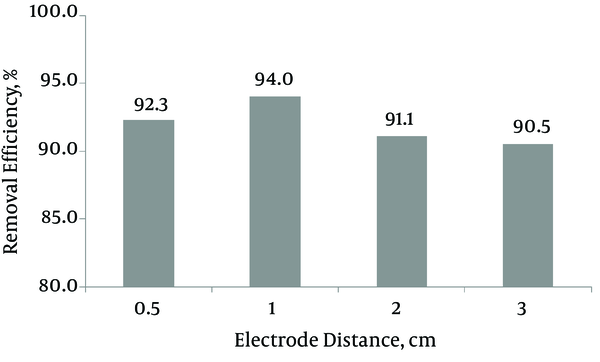
To investigate the influence of space between the electrodes on treatment efficiency, the experiments were performed at varying electrode distance from 0.5 to 3 cm. The results are presented in Figure 3. The MG removal percentages were observed to be 92.4%, 94, 91.1%, and 90.5% for electrode spacing of 0.5, 1, 2, and 3 cm, respectively. Accordingly, the maximum removal percentage was observed at 1 cm electrode spacing. By decreasing electrode spacing from 1 to 0.5 cm, MG removal efficiency also decreased, because anodic oxidation of Fe2+ to Fe3+ could occur when the electrodes were placed too short (21). The removal efficiency decreased as the distance between the electrodes increased up to 1 cm, because a longer distance between the electrodes can limit mass transfer of Fe3+ to the cathode surface which will govern Fe2+ regeneration (22). In addition, an increase in the space between the electrodes results in an increase in ohmic drop through the electrolyte and then an equivalent increase in cell voltage and energy consumption (23).
Effects of distance between the electrodes on color removal; Cdye = 200mg L-1, T = 10 minutes, CD = 10 mA cm-2, pH = 3, CH2O2 = 50mg L-1, temperature = 25ºC

Our results agree with data achieved in other studies, such as COD and color removal from synthetic textile wastewater by EF method (24) and removal of salicylic acid from aqueous solution by EFP (21). Zang et al. (25) studied the removal of COD from landfill leachate by EFP and showed that there existed an optimal distance range between the electrodes (1.3 - 2.1 cm) so that an over 7% higher COD removal was achieved than when the electrodes were positioned beyond this range. Thus, the distance of 1 cm was determined as optimum for the experiment.
3.3. Mineralization Study
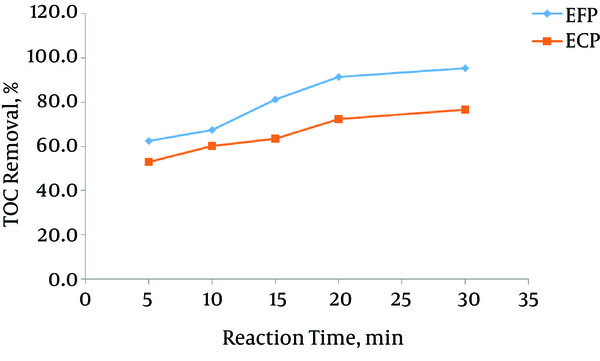
Figure 4 illustrates the rate of dye mineralization as a function of electrolysis time in the EFP and ECP. EFP efficiency was obviously higher than that of ECP. After 30 minutes of treatment, more than 95% of TOC was removed in EFP, meaning that almost all the organic compounds were entirely mineralized to CO2 and H2O while the mineralization efficiency of ECP after 30 minutes was 76.5%. As observed, EFP showed more mineralization efficiency over than ECP; the unselective attaches of hydroxyl free radicals and EFP’s high oxidation potential accounted for the higher mineralization power of EFP (26).
Time-coarse of MG mineralization by EFP and ECP; CD = 10 mA cm-2, pH = 3, CH2O2 = 50mg L-1, d = 1 cm, temperature = 25°C

Akyol et al. (27) investigated removal efficiencies of the liquid organic fertilizer manufacturing wastewater by EFP and ECP using iron electrodes. In their study, EFP resulted in higher removal efficiencies (81% of TOC in 10 min) than that of ECP (79% of TOC in 45 minutes).
3.4. Energy Consumption
The energy consumption values in the EFP and ECP for mineralization of MG dye in different time intervals are calculated and presented in Table 2. Despite high removal efficiency of COD in EFP, the energy consumptions were less than in the ECP. For example, energy consumption in EFP was 0.0189 kWh g-1 COD after 30 minutes for 96.2% of COD reduction, while only 77% of COD abated consuming 0.0236 kWh g-1 COD in ECP.
Energy Consumption Values in the EFP and ECP. Initial COD of Sample = 304 mg L-1, CD = 10 mA cm-2 (I = 0.18 A), pH = 3, CH2O2 = 50 mg L-1, d = 1 cm, V = 15.4 (v)
| Time, Min | Kind of Process | COD Removal, % | EC, kWh/g COD |
|---|---|---|---|
| 5 | EF | 63.9 | 0.0047 |
| EC | 55 | 0.0055 | |
| 10 | EF | 72.9 | 0.0083 |
| EC | 70.1 | 0.0086 | |
| 15 | EF | 85 | 0.0107 |
| EC | 72.2 | 0.0126 | |
| 20 | EF | 92.8 | 0.0131 |
| EC | 75.3 | 0.0161 | |
| 30 | EF | 96.2 | 0.0189 |
| EC | 77 | 0.0236 |
According to Hafaied et al. (17) energy consumptions were approximately 1 kWh/g COD when EFP was applied to treatment of Acid Red18 synthetic solution using a graphite-felt cathode (electrolysis time = 1 hours, initial COD = 56 mg L-1, COD removed = 30%, V = 250 mL, I = 250 mA).
3.5. Conclusion
It has been demonstrated that a synthetic solution of MG dye at high concentrations can be effectively degraded by EFP using sacrificial iron electrode. Under optimal value of process parameters, 96.2% of COD removal was obtained after only 30 minutes of treatment. Under our experimental conditions, the total organic carbon measurements showed an efficient mineralization of 95.3% after 30 minutes of treatment. Moreover, it was found that despite high removal efficiency of COD in the EFP, energy consumption was lower than in ECP. Overall, EFP seems to be a clean and efficient method for the degradation of MG dye in wastewater.
References
-
1.
Fernández C, Larrechi MS, Callao MP. An analytical overview of processes for removing organic dyes from wastewater effluents. TrAC Trends Analyt Chem. 2010;29(10):1202-11. https://doi.org/10.1016/j.trac.2010.07.011.
-
2.
Garg VK, Kumar R, Gupta R. Removal of malachite green dye from aqueous solution by adsorption using agro-industry waste: a case study of Prosopis cineraria. Dyes Pigm. 2004;62(1):1-10. https://doi.org/10.1016/j.dyepig.2003.10.016.
-
3.
Guenfoud F, Mokhtari M, Akrout H. Electrochemical degradation of malachite green with BDD electrodes: Effect of electrochemical parameters. Diam Relat Mater. 2014;46:8-14. https://doi.org/10.1016/j.diamond.2014.04.003.
-
4.
Ghoneim MM, El-Desoky HS, Zidan NM. Electro-Fenton oxidation of Sunset Yellow FCF azo-dye in aqueous solutions. Desalination. 2011;274(1-3):22-30. https://doi.org/10.1016/j.desal.2011.01.062.
-
5.
Oturan MA, Guivarch E, Oturan N, Sirés I. Oxidation pathways of malachite green by Fe3+-catalyzed electro-Fenton process. Appl Catal B. 2008;82(3-4):244-54. https://doi.org/10.1016/j.apcatb.2008.01.016.
-
6.
Bañuelos JA, García-Rodríguez O, El-Ghenymy A, Rodríguez-Valadez FJ, Godínez LA, Brillas E. Advanced oxidation treatment of malachite green dye using a low cost carbon-felt air-diffusion cathode. J Environ Chem Eng. 2016;4(2):2066-75. https://doi.org/10.1016/j.jece.2016.03.012.
-
7.
Singh S, Srivastava VC, Mall ID. Electrochemical treatment of malachite green dye solution using iron electrode. Int J ChemTech Res. 2013;5(2):592-6.
-
8.
Srivastava S, Sinha R, Roy D. Toxicological effects of malachite green. Aquat Toxicol. 2004;66(3):319-29. [PubMed ID: 15129773]. https://doi.org/10.1016/j.aquatox.2003.09.008.
-
9.
Hashemian S. Fenton-like oxidation of malachite green solutions: Kinetic and thermodynamic study. J Chem. 2013;2013:1-7. https://doi.org/10.1155/2013/809318.
-
10.
Kousha M, Farhadian O, Dorafshan S, Mahboobi Soofiani N. [Investigation of the kinetics and nature of malachite green biosorption by green microalgae]. Water Wastewater. 2015;3:37-50. Persian.
-
11.
Mirhasani A, Shahbazi A, Hasheminejad H, Sartaj M. [Optimization of the adsorption of malachite green on the NH2-SBA-15 nano-adsorbant using the taguchi method by gualitic-4 software an isotherm, kinitic,and thermodynamic study]. Water Wastewater. 2014;25(6):10-9. Persian.
-
12.
Man LW. Design of experiments for Malachite Green dye removal from wastewater using thermolysis-coagulation-flocculation. Desalination Water Treat. 2012;40(1-3):260-71.
-
13.
Rosales E, Iglesias O, Pazos M, Sanroman MA. Decolourisation of dyes under electro-Fenton process using Fe alginate gel beads. J Hazard Mater. 2012;213-214:369-77. [PubMed ID: 22381372]. https://doi.org/10.1016/j.jhazmat.2012.02.005.
-
14.
Babuponnusami A, Muthukumar K. Advanced oxidation of phenol: A comparison between Fenton, electro-Fenton, sono-electro-Fenton and photo-electro-Fenton processes. Chem Eng J. 2012;183:1-9. https://doi.org/10.1016/j.cej.2011.12.010.
-
15.
Wang CT, Chou WL, Chung MH, Kuo YM. COD removal from real dyeing wastewater by electro-Fenton technology using an activated carbon fiber cathode. Desalination. 2010;253(1-3):129-34. https://doi.org/10.1016/j.desal.2009.11.020.
-
16.
Anotai J, Lu MC, Chewpreecha P. Kinetics of aniline degradation by Fenton and electro-Fenton processes. Water Res. 2006;40(9):1841-7. [PubMed ID: 16624370]. https://doi.org/10.1016/j.watres.2006.02.033.
-
17.
Hafaiedh NB, Bellakhal N. Mineralization of synthetic and industrial food effluent containing acid red18 by electro-fenton process using a graphite-felt cathode. Int J Sci Res. 2013;6(14).
-
18.
Panizza M, Cerisola G. Electro-Fenton degradation of synthetic dyes. Water Res. 2009;43(2):339-44. [PubMed ID: 18996554]. https://doi.org/10.1016/j.watres.2008.10.028.
-
19.
Wang CT, Hu JL, Chou WL, Kuo YM. Removal of color from real dyeing wastewater by Electro-Fenton technology using a three-dimensional graphite cathode. J Hazard Mater. 2008;152(2):601-6. [PubMed ID: 17707581]. https://doi.org/10.1016/j.jhazmat.2007.07.023.
-
20.
Hameed BH, Lee TW. Degradation of malachite green in aqueous solution by Fenton process. J Hazard Mater. 2009;164(2-3):468-72. [PubMed ID: 18804913]. https://doi.org/10.1016/j.jhazmat.2008.08.018.
-
21.
George SJ, Gandhimathi R, Nidheesh PV, Ramesh ST. Electro-fenton oxidation of salicylic acid from aqueous solution: Batch studies and degradation pathway. Clean (Weinh). 2014;42(12):1701-11. https://doi.org/10.1002/clen.201300453.
-
22.
Qiang Z, Chang JH, Huang CP. Electrochemical regeneration of Fe2+ in Fenton oxidation processes. Water Res. 2003;37(6):1308-19. [PubMed ID: 12598195]. https://doi.org/10.1016/S0043-1354(02)00461-X.
-
23.
Nidheesh PV, Gandhimathi R. Trends in electro-Fenton process for water and wastewater treatment: An overview. Desalination. 2012;299:1-15. https://doi.org/10.1016/j.desal.2012.05.011.
-
24.
Şahinkaya S. COD and color removal from synthetic textile wastewater by ultrasound assisted electro-Fenton oxidation process. Ind Eng Chem Res. 2013;19(2):601-5. https://doi.org/10.1016/j.jiec.2012.09.023.
-
25.
Zhang H, Zhang D, Zhou J. Removal of COD from landfill leachate by electro-Fenton method. J Hazard Mater. 2006;135(1-3):106-11. [PubMed ID: 16359785]. https://doi.org/10.1016/j.jhazmat.2005.11.025.
-
26.
Farhadi S, Aminzadeh B, Torabian A, Khatibikamal V, Alizadeh Fard M. Comparison of COD removal from pharmaceutical wastewater by electrocoagulation, photoelectrocoagulation, peroxi-electrocoagulation and peroxi-photoelectrocoagulation processes. J Hazard Mater. 2012;219-220:35-42. [PubMed ID: 22464981]. https://doi.org/10.1016/j.jhazmat.2012.03.013.
-
27.
Akyol A, Can OT, Demirbas E, Kobya M. A comparative study of electrocoagulation and electro-Fenton for treatment of wastewater from liquid organic fertilizer plant. Sep Purif Technol. 2013;112:11-9. https://doi.org/10.1016/j.seppur.2013.03.036.