Abstract
Background:
Breast cancer and lung cancer are the leading causes of cancer-related mortality in women. Computed tomography (CT) plays an important role in lung cancer examination but an unidentified role in breast examination.Objectives:
To investigate the feasibility of breast composition categorization according to the fifth edition of Breast Imaging-Reporting and Data System (BI-RADS) atlas in low-dose CT screening.Patients and Methods:
This was a cross-sectional study completed in The 5th Affiliated Hospital of Sun Yat-sen University, Zhuhai, China. We collected the imaging data of 57 women, who underwent low-dose chest CT scan and mammography within one week from 1st October 2013 to 31st March 2015. Two radiologists independently interpreted the mammograms and chest CT scans and classified the breast composition into categories a, b, c, and d. We also summarized the distribution of breast composition categories by collecting, observing, and classifying the chest CT scans from 1916 female examinees from 1st October 2013 to 31st March 2016.Results:
Excellent agreement was observed between the two radiologists, using both low-dose CT scan (κ = 0.91) and mammography (κ = 0.86). Agreement between low-dose chest CT scan and mammography was moderate for radiologist A (κ = 0.50) and radiologist B (κ = 0.43). More breasts were classified in categories a and b on the chest CT scan compared to mammography according to both radiologist A (P < 0.01) and radiologist B (P < 0.01). The proportion of non-dense breast tissues (categories a & b) increased with advancing age, while the proportion of dense breast tissues (categories c & d) decreased (P < 0.05). With advancing age, the probability of non-dense breasts increased, while the probability of dense breasts decreased.Conclusions:
Based on the findings, it is feasible to categorize breast composition using low-dose chest CT. In the older age group, the probability of non-dense breasts increased.Keywords
1. Background
Breast cancer and lung cancer are the leading causes of cancer-related mortality in women (1, 2). Early detection and treatment via screening is an effective strategy to reduce cancer-related mortality (3-5). The U.S. preventive services task force (USPSTF) recommends biennial breast cancer screening for women aged 50 - 74 years. Also, women may choose to start biennial screening at the age of 40-49 years if the potential benefits overweigh the potential harms (6). Mammography, ultrasound (US), and magnetic resonance imaging (MRI) are commonly used for detecting breast cancer (7). In addition, low-dose computed tomography (CT) plays a pivotal role in breast examination.
Based on the fourth edition of breast imaging-reporting and data system (BI-RADS) (8), breast density measured by chest CT scan is well correlated with breast density on mammography, and both lung cancer and breast density can be detected using a single CT scan (9-11). Studies show that women with dense breasts experience a 1.8- to 6-fold increase in the risk of breast cancer, compared to those with fatty breasts (12) . Also, some women are exposed to a higher risk of both lung and breast cancers (13, 14). Therefore, breast density categorization is very valuable in low-dose CT screening of women. Low-dose CT screening for lung cancer has been recommended for male and female smokers over the age of 55 years in the United States and over 50 years in China (15). In some regions of China and Japan, where low-dose CT screening was conducted for lung cancer among women above 40 years, similar detection rates were reported in women and non-smokers (4, 5) .
The American college of radiology (ACR) updated the description of breast composition in the fifth edition of BI-RADS in January, 2014 (16). It is important to determine the feasibility of breast composition categorization according to the fifth edition of BI-RADS in women undergoing low-dose CT screening for lung cancer. According to the fifth edition of BI-RADS (16), breast composition is divided into categories a, b, c, and d, based on the visually estimated content of fibroglandular-density breast tissues, without indicating the percentage range of dense tissues. This new categorization is more useful for clinical practice compared to the previous version.
In comparison with the fourth edition of BI-RADS, the current categorization is more helpful in demonstrating the confidence level of breast lesion assessment, as the possibility of obscured breast lesion is related to the breast density category. Detection of a breast lesion in categories a and b is more accurate than tissues in categories c and d. We hypothesized that evaluation of breast composition based on CT scans may be superior to mammography. Therefore, in this retrospective study, we aimed to assess and compare the feasibility of breast composition categorization using low-dose CT scan and mammography.
2. Objectives
To investigate the feasibility of breast composition categorization according to the fifth edition of breast imaging-reporting and data system (BI-RADS) atlas in low-dose computed tomography (CT) screening.
3. Patients and Methods
3.1. Study Sample
After the institutional review board approved the study protocol, we collected data from women, who had undergone both routine mammography and low-dose chest CT screening in our hospital within one week. The requirement for an informed consent was waived. All examinations were performed after menopause or about one week after the menstrual period. Women with breast implants were excluded. Finally, 57 women were included in this study, 11 of whom had received unilateral mastectomy for breast cancer. The subjects were in the age range of 40 - 77 years (mean: 48 years). We also summarized the distribution of breast composition categories by collecting, observing, and classifying the chest CT scans of 1916 female subjects over 40 years (range: 40 - 86 years; mean: 51 years) from October 2013 to March 2016, in The 5th Affiliated Hospital of Sun Yat-sen University, Zhuhai, China.
3.2. Imaging Procedures
CT scan was performed by using a 16-detector CT scanner (SOMATOM Sensation 16, Siemens, Germany) at 120 kV and 30 - 80 mAs. Images were reconstructed at a slice thickness of 5 mm, window level of 50 Hounsfield units (HU), and window width of 350 HU. On the other hand, mammography was performed using a digital mammography system (Giotto 6050-3, Italy) at 25 - 30 kV and 55 - 65 mAs. All images were sent to picture archiving and communication system (PACS; Fuji, Japan) for interpretation.
3.3. Categorization of Breast Composition
Two radiologists (A and B), with 4 and 13 years of CT experience, respectively, interpreted the mammograms independently and divided the breasts into four categories according to the fifth edition of BI-RADS. Category a was defined as breasts which are almost entirely fatty, category b was defined as breasts with scattered areas of fibroglandular density, category c was defined as heterogeneously dense breasts which may obscure small masses, and category d was defined as extremely dense breasts which reduce the sensitivity of mammography. To reduce memory bias, all CT scans was performed one month after mammography.
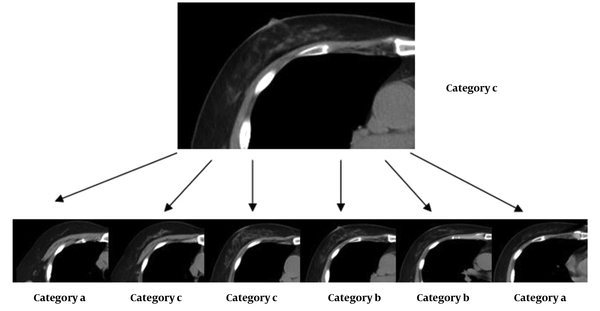
The two radiologists divided the breasts into four categories according to their subjective assessment as soon as they studied the images layer by layer (Figure 1). If it was deduced that the breasts are almost entirely fatty, they were assigned to category a. Breasts with scattered areas of fibroglandular density were classified in category b, while heterogeneously dense breasts, which might obscure small masses, were classified in category c. Finally, extremely dense breasts, which reduced the sensitivity of mammography, were classified in category d.
Breast composition classification relative to the highest category based on image readings
3.4. Lesion Detection
Following independent reviews for classification of breast composition, the two radiologists conducted a joint reading for identifying any possible abnormalities, including micro-calcification and masses; they reached a consensus for any discrepancy through discussion. The reference standard was established by consolidation of findings on CT scan and mammography.
3.5. Statistical Methods
All statistical analyses were performed using SPSS version 13.0 (Chicago, USA). Mean was used to measure the quantitative. Kappa test was used to measure the agreement between two observers (0.20 - 0.40: fair agreement; 0.40 - 0.60: moderate agreement; 0.60 - 0.80: substantial agreement; and 0.80 - 1.00: excellent agreement). Chi-square test was also used to compare screening performance for less dense breasts between the two radiologists, two interpretation methods, and different age groups. P < 0.05 was considered statistically significant.
4. Results
Excellent agreement was observed between the readings of two radiologists using mammography (κ = 0.86, Table 1). Following the review of mammograms, one breast was classified in category a by radiologist A, and in category c by radiologist B. Also, four breasts were classified in category c by radiologist A, and in category b by radiologist B. Similarly, excellent agreement was observed between the two radiologists based on CT scans (κ = 0.91, Table 2). Following the review of CT images, four breasts were classified in category c by radiologist A, and in category b by radiologist B. Also, one breast was classified in category d by radiologist A, and in category c by radiologist B.
Breast Composition Categories of Two Radiologists Using Mammography
| Radiologist A | Radiologist B | Total | |||
|---|---|---|---|---|---|
| Category a | Category b | Category c | Category d | ||
| Category a | 2 | 0 | 0 | 0 | 2 |
| Category b | 0 | 17 | 1 | 0 | 18 |
| Category c | 0 | 4 | 79 | 0 | 83 |
| Category d | 0 | 0 | 0 | 0 | 0 |
| Total | 2 | 21 | 80 | 0 | 103 |
Breast Composition Categories of Two Radiologists Using CT Scan
| Radiologist A | Radiologist B | Total | |||
|---|---|---|---|---|---|
| Category a | Category b | Category c | Category d | ||
| Category a | 6 | 0 | 0 | 0 | 6 |
| Category b | 0 | 30 | 0 | 0 | 30 |
| Category c | 0 | 4 | 60 | 0 | 64 |
| Category d | 0 | 0 | 1 | 2 | 3 |
| Total | 6 | 34 | 61 | 2 | 103 |
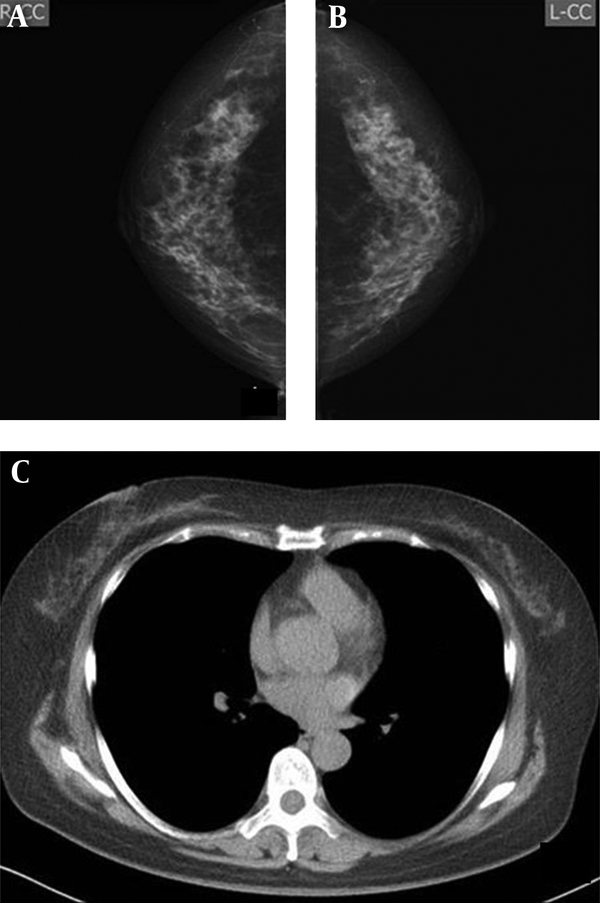
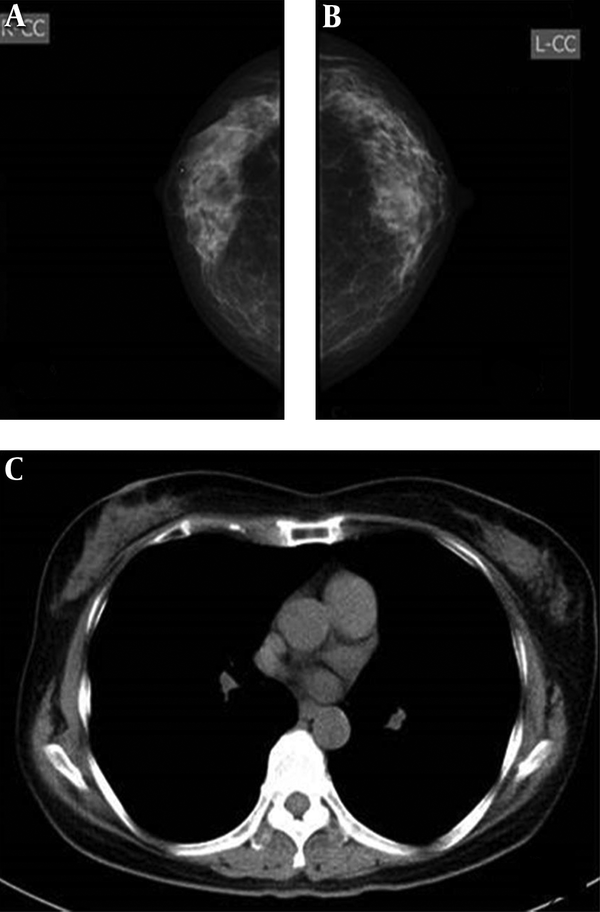
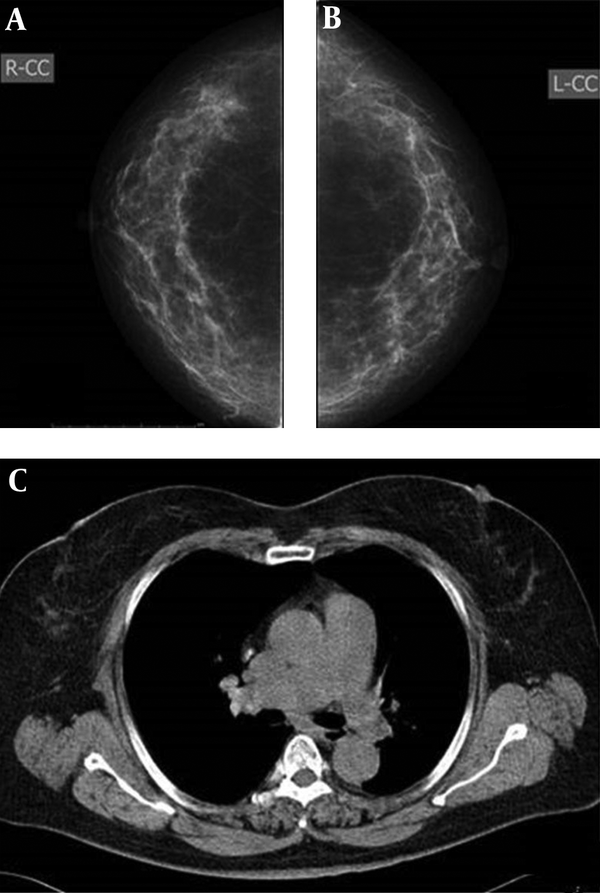
Agreement between the two imaging modalities was moderate for both radiologists (radiologist A: κ = 0.50; radiologist B: κ = 0.43) (Figures 2-4). Radiologist A classified 1.94% (2/103) of breasts in category a, 17.48% (18/103) in category b, 80.58% (83/103) in category c, and none in category d after reviewing the mammograms. The distribution of corresponding categories, based on CT scans, was 5.82% (6/103), 29.13% (30/103), 62.14% (64/103), and 2.91% (3/103), respectively. Radiologist B classified 1.94% (2/103) of breasts in category a, 20.39% (21/103) in category b, 77.67% (80/103) in category c, and none in category d after reviewing the mammograms. Also, based on CT images, the distribution of corresponding categories was 5.83% (6/103), 33.01% (34/103), 59.22% (61/103), and 1.94% (2/103), respectively.
Imaging findings of a 54-year-old woman. A and B, Mammography, in which both radiologists classified bilateral breasts in category c on the mammogram C, CT scan, in which category b was defined.
Imaging findings of a 57-year-old woman. A and B, mammography, both radiologists classified bilateral breasts in category c. C, CT scan, classified as category c.
Imaging findings of a 57-year-old woman. A and B, Mammography, both radiologists classified bilateral breasts in category b. C, CT scan, defined as category c.
Classification of non-dense breasts (categories a & b, defined as type I) was not significantly different between the two radiologists, based on the mammograms (19.42% vs. 22.33%, P > 0.05) and CT scans (34.95% vs. 38.84%, P > 0.05). However, both radiologists classified significantly more breasts as non-dense according to CT scans, compared to mammography (radiologist A: 34.95% vs. 19.42%, P < 0.01; radiologist B, 38.84% vs. 22.34%, P < 0.01) (Table 3).
Classification of Type I Breasts by the Radiologists Using Two Imaging Modalities
| Radiologist A | Radiologist B | P-value | |
|---|---|---|---|
| Mammography | 20 (19.42%) | 23 (22.33%) | 0.25 |
| CT scan | 36 (34.95%) | 40 (38.84%) | 0.13 |
| P-value | < 0.01 | < 0.01 |
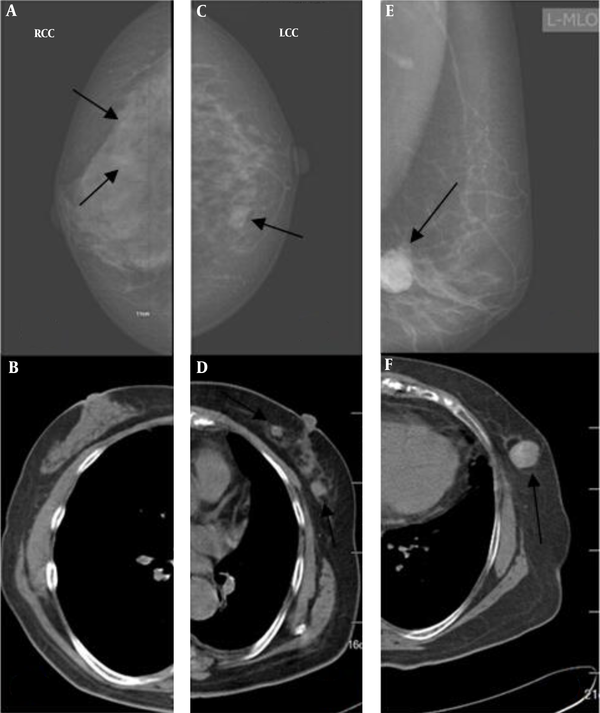
Regarding breast abnormalities, micro-calcification was detected in three breasts only based on the mammograms. Of nine breasts with masses on CT images, two were missed in mammography (Figure 5).
A and B, Imaging findings of a 61-year-old woman. Both radiologists detected micro-calcification on the mammograms of the right breast (arrows) (A), but not on the CT scan (B). C and D, Imaging findings of a 72-year-old woman. Both radiologists were more confident about nodules detected on the CT scan (arrow) (D) compared to the mammogram (arrow) (C). E and F, Imaging findings of a 70-year-old woman. Both radiologists classified bilateral breasts in category b on the mammogram (arrow) (E), but in category a on the CT scan (F). Both radiologists were confident about the mass detected on the mammogram (E) and the CT scan (arrow) (F).
Moreover, we retrospectively collected the chest CT scans of 1916 female examinees (age: 40-86 years) and divided them into four groups with ten-year gaps: group 1 (40 - 49 years; n = 991); group 2 (50 - 59 years; n = 649); group 3 (60 - 69 years; n = 181); and group 4 (> 70 years; n = 95). The two radiologists read the CT scans, evaluated the breast composition, and resolved disagreements through discussion.
In group 1, 0.9% (9/991) of breasts was classified in category a, 18.06% (179/991) in category b, 77.90% (772/991) in category c, and 3.13% (31/991) in category d. In group 2, 2.77% (18/649) of breasts were classified in category a, 29.74% (193/649) in category b, 67.03% (435/649) in category c, and 0.46% (3/649) in category d. Also, in group 3, 15.47% (28/181) of women were classified in category a, 46.41% (84/181) in category b, 37.57% (68/181) in category c, and 0.55% (1/181) in category d. Finally, in group 4, 23.16% (22/95) were classified in category a, 56.84% (54/95) in category b, 20.00% (19/95) in category c, and 0% in category d (Table 4). In the older age group, the probability of non-dense breasts increased, while the probability of dense breasts decreased (Figures 6 and 7). The difference between the groups was statistically significant (P < 0.001). The difference between each age group was statistically significant (group 1 vs. 2, P < 0.001, group 1 vs. 3 , P < 0.001, group 1 vs. 4, χ2 = P < 0.001, group 2 vs. 3 , P < 0.001, group 2 vs. 4, P < 0.001, group 3 vs. 4 , P = 0.018). The difference between each category group was statistically significant (category a vs. b, P < 0.001, category a vs. c, P < 0.001, category a vs. d, P < 0.001, category b vs. c, P < 0.001, category b vs. d, P < 0.001, category c vs. d, P = 0.007).
With advancing age, the probability of non-dense breasts is increased, while the probability of dense breasts is decreased.
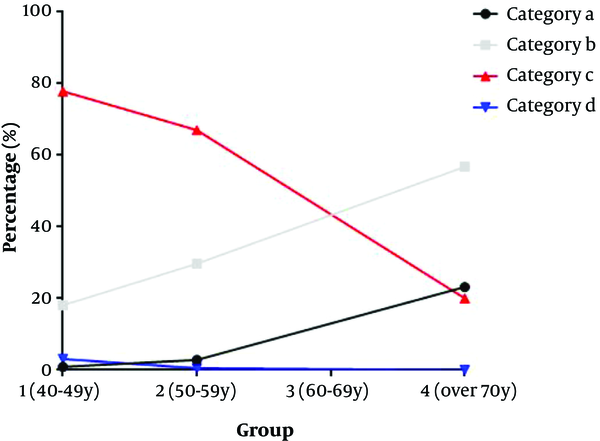
Breast composition changes in different age groups. With advancing age, the ratio of dense breasts decreases.

Breast Composition Categories in 1916 Female Examinees (%)
| Groups | Breast composition categories | |||
|---|---|---|---|---|
| Category a | Category b | Category c | Category d | |
| 1 (40 - 49 y) | 0.91 (9/991) | 18.06 (179/991) | 77.90 (772/991) | 3.13 (31/991) |
| 2 (50 - 59 y) | 2.77 (18/649) | 29.74 (193/649) | 67.03 (435/649) | 0.46 (3/649) |
| 3 (60 - 69 y) | 15.47 (28/181) | 46.41 (84/181) | 37.57 (68/181) | 0.55 (1/181) |
| 4 (≥ 70 y) | 23.16 (22/95) | 56.84 (54/95) | 20.00 (19/95) | 0 (0/95) |
5. Discussion
The feasibility of breast density assessment is influenced by inter-observer variability (17, 18). We evaluated the composition of 103 breasts and observed high agreement between the two radiologists by using both low-dose chest CT scan and mammography. This finding is consistent with the results reported by Salvatore et al. (9), which showed that radiologists’ agreement in the assessment of breast density with CT scan is higher than mammography (kCT vs. kmom = 0.79 vs. 0.62). It seems that the superiority of CT scan is related to sectional images, which reduce overlap between the fibrous gland and fatty tissue, unlike mammography. Similar to the study by Salvatore et al., some cases classified in category c based on mammography were classified in category d based on CT scans. It should be noted that the breast tissue may be compressed by gravity in the supine position during scanning.
Breast density is an independent risk factor for breast cancer (12, 17); therefore, evaluation of breast density is very important. The fifth edition of BI-RADS presents an updated description of breast composition (16) , based on the density and distribution of fibroglandular tissue rather than its percentage. In comparison with the fourth edition of BI-RADS, the current categorization is more helpful in indicating the confidence level of breast lesion assessment, since the likelihood of breast lesion being obscured is related to the breast density category.
Generally, classification of a breast lesion in category a or b is more definite than categories c and d. Our findings revealed that more breasts were classified in categories a and b based on low-dose CT scans, compared to mammography; this indicates that the radiologists were more confident about some breast lesions based on CT scans. The superiority of CT scan may be attributed to sectional images, which reduce the overlap between the fibrous gland and fatty tissue. In this regard, Boone et al. (19) reported similar findings in the assessment of breast composition using MRI.
According to many studies, the risk of breast cancer in women with dense breasts is 1.8 to 6 times higher than women with fatty breasts (12, 17). However, the diagnostic rate of cancer in dense breasts based on mammography seems to be much lower than that of fatty breasts (42% vs. 98%) (20). As indicated in the current study, CT scans identified more breasts as non-dense compared to mammograms, and identification of breast lesions was reliable.
Additionally, it was found that the prevalence of non-dense breasts increased with aging in women from Zhuhai, China; this is mainly due to the loss of fatty tissues with advancing age; also, most women aged 40-60 years had dense breasts. These findings are consistent with the fact that in epidemiology, most breast cancers are speculated to occur between 45 and 55 years of age (2). Therefore, women aged 40 years or above, who are candidates for low-dose CT scan to screen for lung cancer, are suggested to undergo breast examination simultaneously. Also, a negative finding of non-dense breasts on a CT scan may indicate that no further mammography is needed for breast screening. However, further characterization of lesions in non-dense breasts, as well as detection of lesions in dense breasts, is necessary by using more effective modalities, such as mammography, ultrasound, and MRI.
There were limitations in the present study. First, the sample size (103 breasts) was small, even though our preliminary study had indicated significant differences in the classification of breasts between CT scan and mammography. Second, the breasts of category d are rare in women, as breast tissues at this age usually undergo degenerative changes and become fatty tissues. Finally, we did not compare CT scan and mammography in terms of breast lesion detection. Therefore, further research with a larger sample size can help confirm the value of CT scan in breast imaging.
In conclusion, based on the findings, it is feasible to categorize breast composition using low-dose chest CT. In the older age group, the probability of non-dense breasts increase.
References
-
1.
Parkin DM, Bray F, Ferlay J, Jemal A. Cancer in Africa 2012. Cancer Epidemiol Biomarkers Prev. 2014;23(6):953-66. [PubMed ID: 24700176]. https://doi.org/10.1158/1055-9965.EPI-14-0281.
-
2.
Torre LA, Bray F, Siegel RL, Ferlay J, Lortet-Tieulent J, Jemal A. Global cancer statistics, 2012. CA Cancer J Clin. 2015;65(2):87-108. [PubMed ID: 25651787]. https://doi.org/10.3322/caac.21262.
-
3.
Smith-Bindman R, Miglioretti DL, Lurie N, Abraham L, Ballard Barbash R, Strzelczyk J, et al. Does Utilization of Screening Mammography Explain Racial and Ethnic Differences in Breast Cancer? Annals of Internal Medicine. 2006:541-53.
-
4.
Sone S, Matsumoto T, Honda T, Tsushima K, Takayama F, Hanaoka T, et al. HRCT features of small peripheral lung carcinomas detected in a low-dose CT screening program. Acad Radiol. 2010;17(1):75-83. [PubMed ID: 19879779]. https://doi.org/10.1016/j.acra.2009.08.003.
-
5.
Liu X, Liang M, Wang Y, Chen K, Chen X, Qin P, et al. The outcome differences of CT screening for lung cancer pre and post following an algorithm in Zhuhai, China. Lung Cancer. 2011;73(2):230-6. [PubMed ID: 21168238]. https://doi.org/10.1016/j.lungcan.2010.11.012.
-
6.
Siu AL, U. S. Preventive Services Task Force. Screening for Breast Cancer: U.S. Preventive Services Task Force Recommendation Statement. Ann Intern Med. 2016;164(4):279-96. [PubMed ID: 26757170]. https://doi.org/10.7326/M15-2886.
-
7.
Weiss JE, Goodrich M, Harris KA, Chicoine RE, Synnestvedt MB, Pyle SJ, et al. Challenges With Identifying Indication for Examination in Breast Imaging as a Key Clinical Attribute in Practice, Research, and Policy. J Am Coll Radiol. 2017;14(2):198-207 e2. [PubMed ID: 27744009]. [PubMed Central ID: PMC5292278]. https://doi.org/10.1016/j.jacr.2016.08.017.
-
8.
Tardivon A, el Khoury C, Thibault F, Meunier M. [New developments in breast imaging]. Cancer Radiother. 2004;8(1):2-8. [PubMed ID: 15093195]. https://doi.org/10.1016/j.canrad.2003.10.003.
-
9.
Salvatore M, Margolies L, Kale M, Wisnivesky J, Kotkin S, Henschke CI, et al. Breast Density: Chest CT versus Mammography. Radiology. 2014;270:67-73.
-
10.
Bakic PR, Carton A, Kontos D, Zhang C, Troxel AB, Maidment AD. BREAST IMAGING: Breast Percent Density Estimations. radiology. 2009;252:40-9.
-
11.
Moon WK, Lo CM, Goo JM, Bae MS, Chang JM, Huang CS, et al. Quantitative analysis for breast density estimation in low dose chest CT scans. J Med Syst. 2014;38(3):21. [PubMed ID: 24643751]. https://doi.org/10.1007/s10916-014-0021-5.
-
12.
Boyd NF, Dite GS, Stone J; et al. Heritability of mammographic density, a risk factor for breast cancer. The New England Journal of Medicine. 2002;347:886-94.
-
13.
Chengfeng W, Ping Z, Xiaofeng B, Haipeng W, Yuekui B. Breast cancer in multiple primary malignant neoplasms, epidemiological and clinical analysis. National Medical Journal of China. 2002;82:1229-31.
-
14.
Mellemkjaer L, Friis S, Olsen JH, Scelo G, Hemminki K, Tracey E, et al. Risk of second cancer among women with breast cancer. Int J Cancer. 2006;118(9):2285-92. [PubMed ID: 16342146]. https://doi.org/10.1002/ijc.21651.
-
15.
Canadian Task Force on Preventive Health Care. recommendations on screening for lung cancer 2016. CMAJ. 2016;188:425-32. https://doi.org/10.1503/cmaj.151421/-/DC1.
-
16.
Mercado CL. BI-RADS update. Radiol Clin North Am. 2014;52(3):481-7. [PubMed ID: 24792650]. https://doi.org/10.1016/j.rcl.2014.02.008.
-
17.
Hooley RJ, Greenberg KL, Stackhouse RM, Geisel JL, Butler RS, Philpotts LE. screening Us in Patients with Mammographically Dense Breasts: Initial Experience with Connecticut Public Act 09-41. Radiology. 2012;265:59-69.
-
18.
Weigert J, Steenbergen S. The connecticut experiment: the role of ultrasound in the screening of women with dense breasts. Breast J. 2012;18(6):517-22. [PubMed ID: 23009208]. https://doi.org/10.1111/tbj.12003.
-
19.
Boone JM, Yang K; et al. An X-ray Computed Tomography/Positron Emission Tomography System Designed Specifically for Breast Imaging. Technology in Cancer Research and Treatment. 2010;9:29-44.
-
20.
Kolb TM, Lichy J, Newhouse JH. Comparison of the performance of screening, mammography, physical examination and breast US and evaluation of factors that influence them: an analysis of 27,825 patient evaluations. Radiology. 2002;225:165-75.
